Understanding the Results
After completing a semen analysis using Ongo Vision, the app will display a comprehensive results page. This article will guide you through understanding and interpreting the information provided on the results screen.
Results Page Layout
The results page is divided into two main sections:
- Contextual Info Panel (left side):
- Animal ID
- Collection date
- Remarks
- Sample ID
- Repeat counts
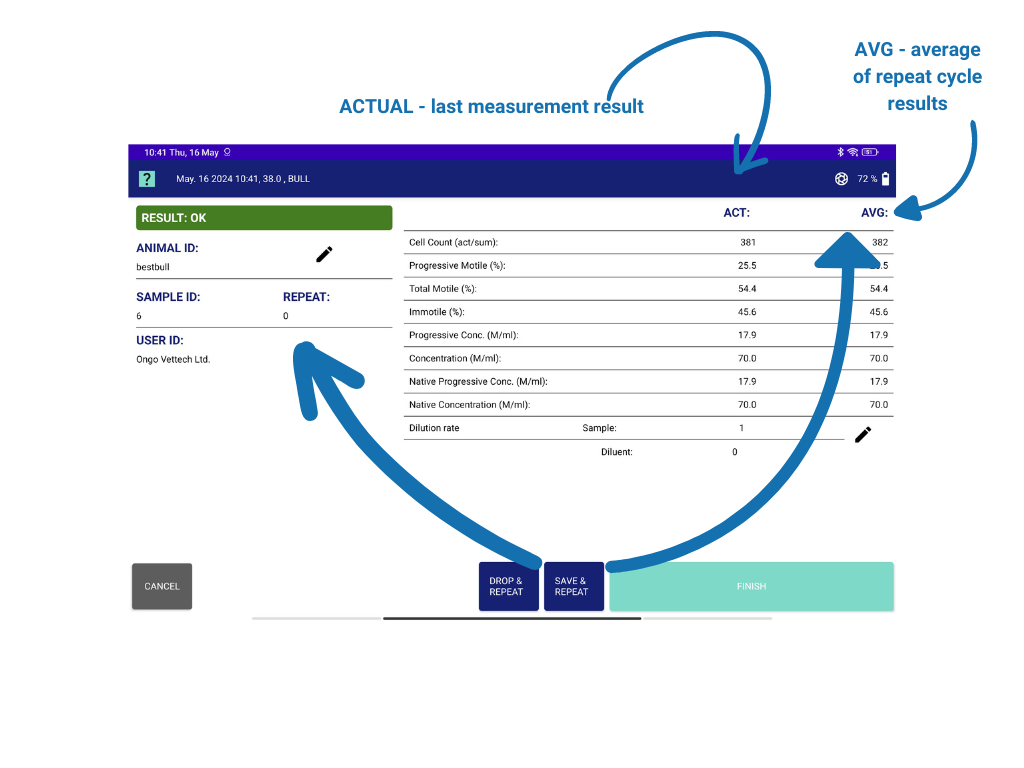
- Results Panel (right side):
- Current Measurement (ACT):
- Cell count
- Concentration
- Motility
- Repeated Measurements (AVG):
- Average concentration and motility across repeats
- Total cell count from all repeats
- Current Measurement (ACT):
- Navigation Buttons (bottom):
- Drop & Repeat
- Save & Repeat
- Finish
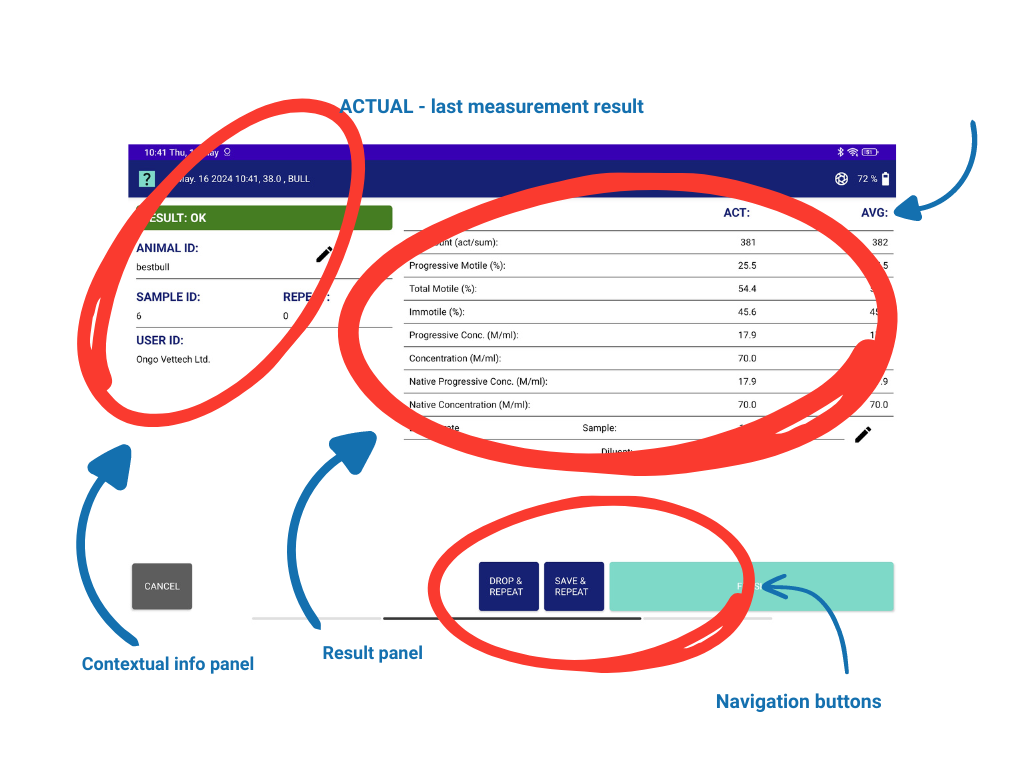
This layout organizes results for easy navigation and interpretation.
Contextual Info Panel
The left panel on the Ongo Vision results page includes:
- Sample ID: An auto-generated ID for each analysis, organizing data for easy access.
- Measurement Repeats: Displays the number of analyses done on the same chamber, enhancing accuracy.
The purpose of repeating measurements is to analyze different parts of the sample, offering a comprehensive data range and improving statistical accuracy by addressing sample heterogeneity. Multiple measurements ensure a reliable assessment of semen quality, integrating varied observations for a representative analysis.
Results Panel
The right panel on the Ongo Vision results page details:
- Current Measurement (ACT): Shows cell count, concentration, and motility for the current analysis, essential for immediate semen quality assessment.
- Repeated Measurements (AVG):
- Average Data: Displays averaged concentration and motility across repeats, offering a reliable quality indicator.
- Cell Count Summation: Lists total cell count from all repeats, providing comprehensive cell analysis.
This layout combines current data with averages for accurate semen analysis and pre-dilution concentration insights.
Concluding the Analysis
To obtain the most accurate results, aim for a cumulative cell count of approximately 1000 via 3-4 measurements on different slide areas.
If working with a fresh ejaculate, input the sample-to-dilution ratio for pre-dilution concentration. The default (1:0) is used if pre-dilution calculation isn't needed.
When you have completed your desired number of measurements, you have three options:
- Drop & Repeat: Exclude inaccurate results and start a new cycle without them.
- Save & Repeat: Save current data and proceed with additional measurements for comprehensive analysis.
- Finish: End the session, returning to the app's main screen for new tasks or reviews.
After selecting "Finish," an on-screen message will specify where the results are saved, using the Sample ID or another identifier for easy access. Results can be found in the Ongo folder, including data reports in PDF or text format, and any analysis visuals. From this folder, you can review, share, or archive results directly, with options for sharing or exporting data as provided by the app.
Next Steps
With a clear understanding of your semen analysis results, you can now make informed decisions based on the data provided by Ongo Vision. For more information on how to export and share your results, please refer to the Exporting and Sharing Data article.
If you have any questions or need further assistance interpreting your results, please consult our Troubleshooting Guide or contact our customer support team.